
The 5 Property Investment ‘Rules’ You Should Break (Before You Lose Money)
In 2023, a report from CoreLogic revealed that nearly 40% of Australian property investors who purchased between 2020 and 2022 were operating at a net loss—despite adhering to long-standing investment “rules.” These guidelines, like the 1% rule or the 5% rule, were once considered sacrosanct, yet they now falter under the weight of rising interest rates, shifting tax policies, and volatile rental markets.
Dr. Cameron Kusher, Director of Economic Research at REA Group, noted in a recent analysis that “blindly following outdated metrics ignores the granular realities of today’s property landscape, where regional variations and unforeseen costs dominate.” For instance, properties in Brisbane’s outer suburbs, which seemed to meet traditional benchmarks, saw maintenance costs surge by over 25% in just two years due to extreme weather events.
The persistence of these rules, despite their diminishing relevance, underscores a deeper issue: the allure of simplicity in an increasingly complex market.

Image source: rentwithfreedom.com
Origins and Purpose of Investment Rules
The foundational property investment rules, such as the 1% rule or the 5% rule, emerged as heuristic tools designed to simplify decision-making in an era of relative market stability. These rules were not arbitrary; they were grounded in historical data and economic conditions where property values, rental yields, and maintenance costs followed predictable patterns. Their primary purpose was to provide investors with a quick, actionable framework to assess potential investments without requiring extensive financial modeling.
However, the underlying mechanisms of these rules reveal their limitations in today’s dynamic market. For instance, the 1% rule assumes a static relationship between rental income and property value, yet fails to account for regional disparities in insurance premiums, property taxes, or climate-related risks. A comparative analysis of urban versus regional markets highlights this disparity: while the rule may still hold in high-demand metropolitan areas, it often collapses in regions with volatile economic conditions or infrastructure deficits.
“The simplicity of these rules is both their strength and their Achilles’ heel. They work as starting points but falter under the weight of modern complexities.”
— Dr. Cameron Kusher, Director of Economic Research, REA Group
To adapt, investors must treat these rules as flexible guidelines, integrating them with advanced tools like predictive analytics and cash flow sensitivity analysis to navigate today’s nuanced property landscape.
Commonly Accepted Rules: 1%, 5-Year, and 5% Rules
The 1%, 5-year, and 5% rules, while historically valuable, often falter under the weight of today’s intricate property markets. Each rule simplifies decision-making but struggles to accommodate the nuanced realities of modern real estate investing.
The 1% rule, for instance, assumes that monthly rent equating to 1% of a property’s purchase price ensures profitability. However, this metric fails in high-cost urban markets where property taxes, insurance premiums, and maintenance costs outpace rental income. A Sydney investor recently discovered this when a property meeting the 1% threshold on paper became unviable due to unforeseen strata levies and rising interest rates.
Similarly, the 5-year rule, which estimates the breakeven point for homeownership, often underestimates transaction costs like stamp duty and agent fees. In slower markets, extended holding periods can erode returns, particularly when capital growth stagnates.
The 5% rule, designed to compare renting versus owning, also oversimplifies. It neglects regional variables such as cyclone insurance in Queensland or bushfire risk in Victoria, which can significantly inflate ownership costs.
“Rigid adherence to these rules risks overlooking the granular realities of today’s property landscape.”
— Dr. Cameron Kusher, Director of Economic Research, REA Group
Investors must adopt adaptive strategies, integrating these rules with localized data and advanced financial modeling to navigate evolving market dynamics effectively.
The 1% Rule: When It Fails
The 1% rule, while a convenient benchmark, often collapses under the weight of modern property market complexities. For instance, in 2024, a CoreLogic study revealed that 62% of properties in Sydney’s inner suburbs failed to meet the 1% threshold, primarily due to skyrocketing property values and stagnant rental growth. This disconnect highlights a critical flaw: the rule assumes static relationships between purchase price and rental income, ignoring dynamic factors like regional economic shifts and regulatory changes.
A striking example comes from Brisbane, where properties meeting the 1% rule on paper saw profitability eroded by a 30% surge in insurance premiums following extreme weather events. This underscores the rule’s inability to account for location-specific risks, such as climate-related costs or infrastructure deficits.
Much like relying on a single compass in turbulent seas, adhering rigidly to the 1% rule can obscure the nuanced interplay of variables that define true investment viability.

Image source: vecteezy.com
Calculating the 1% Rule and Its Limitations
The 1% rule, while straightforward in theory, often falters when applied to real-world scenarios due to its inability to account for variable costs and market-specific dynamics. At its core, the rule suggests that a property’s monthly rent should equal at least 1% of its purchase price. However, this calculation oversimplifies the intricate financial landscape of property investment.
One critical limitation lies in its exclusion of operating expenses. For instance, in regions like Queensland, where cyclone insurance premiums can significantly inflate ownership costs, the 1% rule may mislead investors into overestimating profitability. Similarly, high property taxes in metropolitan areas like Sydney can erode returns, even when the rule appears to be met on paper.
A comparative analysis reveals that alternative metrics, such as the internal rate of return (IRR), provide a more comprehensive evaluation by incorporating cash flow, appreciation potential, and expense variability. While the 1% rule offers a quick screening tool, its rigidity often fails in markets with volatile economic conditions or unique regulatory frameworks.
“Legacy metrics like the 1% rule are useful starting points but must be adapted to reflect the complexities of today’s property markets.”
— Dr. Cameron Kusher, Director of Economic Research, REA Group
To navigate these challenges, investors should integrate localized data and advanced financial modeling, ensuring a more accurate assessment of long-term viability.
Case Studies: Negative Cash Flow in High-Cost Markets
In high-cost markets, the 1% rule often fails to account for the intricate financial pressures that erode profitability. A striking example comes from Sydney, where a property initially meeting the 1% threshold became unviable due to escalating strata levies and council rates. These hidden costs, compounded by stagnant rental growth, highlight the rule’s inability to adapt to dynamic market conditions.
The underlying issue lies in the rule’s static nature. It assumes a fixed relationship between rent and purchase price, ignoring variables like regional insurance premiums or maintenance costs. For instance, properties in Melbourne’s bushfire-prone areas often face insurance premiums that can exceed $5,000 annually, a factor that significantly impacts cash flow but is invisible in the 1% calculation.
A comparative analysis reveals that alternative metrics, such as the debt-service coverage ratio (DSCR), offer a more nuanced evaluation. Unlike the 1% rule, DSCR incorporates operating expenses and debt obligations, providing a clearer picture of financial sustainability. However, even this metric requires adjustment for location-specific risks.
“Static metrics like the 1% rule fail to capture the dynamic interplay of costs in high-risk areas.”
— Dr. Cameron Kusher, Director of Economic Research, REA Group
To mitigate these challenges, investors should integrate predictive analytics and localized data, ensuring a comprehensive understanding of market-specific risks. This approach transforms static benchmarks into actionable insights, reducing the likelihood of negative cash flow surprises.
Reevaluating the 5-Year Rule
The 5-year rule, often touted as a benchmark for recouping property investment costs, falters when confronted with today’s volatile market dynamics and escalating transaction expenses. A 2024 report by the Australian Bureau of Statistics revealed that average stamp duty costs in New South Wales surged by 18% over five years, while agent commissions in metropolitan areas now exceed 2.5% of sale prices. These figures alone can extend the breakeven timeline well beyond the traditional five-year horizon.
Critically, the rule overlooks the compounding impact of holding costs during market downturns. For instance, in regions like Perth, where property values declined by 6% between 2020 and 2023, investors faced prolonged holding periods, eroding equity gains. This demonstrates that the rule’s static assumptions fail to account for fluctuating market conditions and regional disparities.
A more robust approach involves integrating dynamic financial models, such as discounted cash flow (DCF) analysis, to evaluate long-term viability. By incorporating variables like market cycles and transaction costs, investors can replace outdated heuristics with actionable, data-driven strategies.
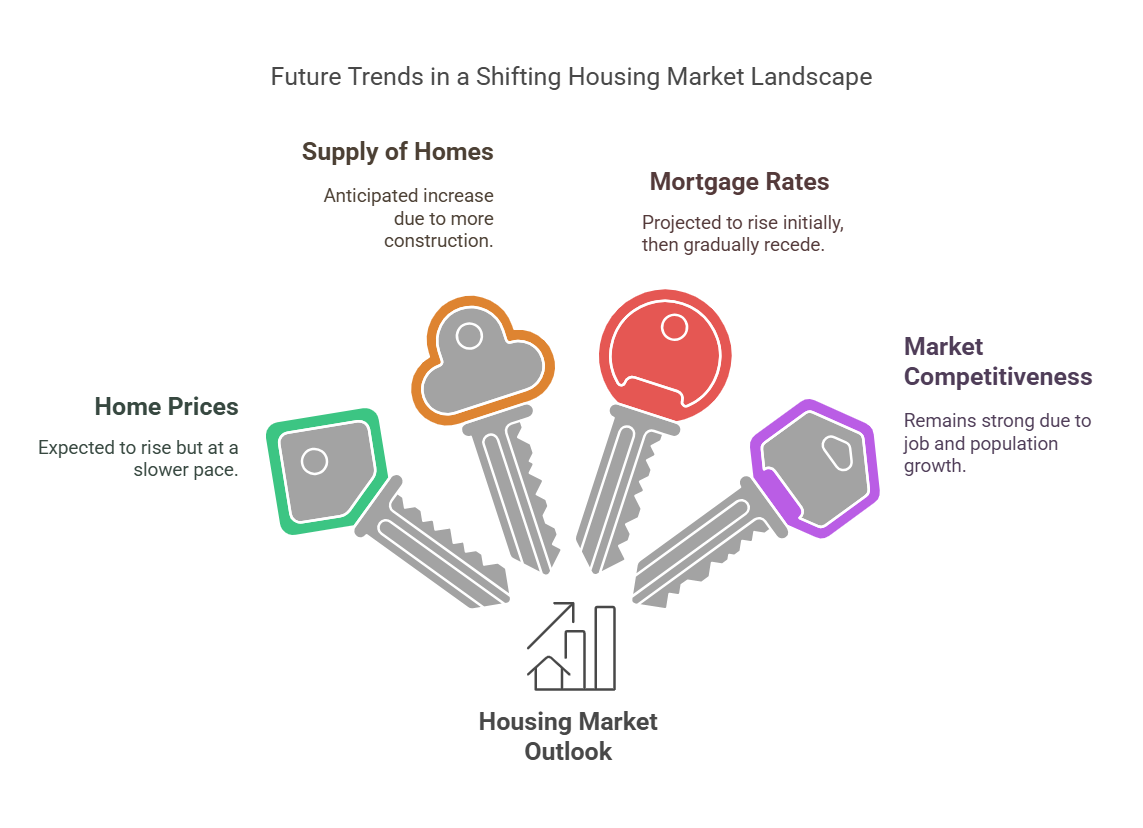
Image source: noradarealestate.com
Transaction Costs and Market Volatility
Transaction costs, often underestimated, can significantly distort the 5-year rule’s applicability, particularly in volatile markets. Stamp duty, agent commissions, and legal fees are not static; they fluctuate based on regional policies and market conditions. For instance, in Sydney, stamp duty reforms in 2024 led to a 15% increase in average transaction costs, disproportionately affecting mid-tier property investors. These costs, compounded by market volatility, can extend breakeven timelines far beyond five years.
Market volatility further complicates this equation. Economic downturns or sudden interest rate hikes can suppress property values, forcing investors to hold assets longer than anticipated. A comparative analysis of Perth and Brisbane markets between 2020 and 2023 revealed that investors in Perth faced extended holding periods due to a 6% property value decline, while Brisbane’s market volatility was mitigated by stronger population growth and infrastructure investments.
To address these challenges, dynamic cash flow modeling emerges as a superior alternative. By incorporating transaction costs, market cycles, and sensitivity analysis, this approach provides a realistic projection of investment viability.
“Static rules like the 5-year benchmark fail to account for the compounding impact of transaction costs and market shifts.”
— Dr. Cameron Kusher, Director of Economic Research, REA Group
This nuanced strategy equips investors to navigate uncertainties, ensuring informed, data-driven decisions.
Extended Break-Even Periods: A New Reality
The traditional 5-year rule often fails to account for the compounding effects of transaction costs and market volatility, which can significantly extend breakeven periods. In today’s dynamic property landscape, factors such as fluctuating stamp duties, rising agent commissions, and unexpected legal fees have become critical variables. For instance, a 2024 study by the Australian Bureau of Statistics revealed that stamp duty reforms in New South Wales increased transaction costs by 18%, disproportionately impacting mid-tier investors.
This shift underscores the need for dynamic financial modeling. Unlike static benchmarks, scenario-based cash flow models incorporate variables such as market cycles, transaction costs, and holding period risks. These models allow investors to simulate multiple outcomes, providing a clearer picture of long-term viability. For example, a Brisbane-based investor used a discounted cash flow (DCF) analysis to identify that holding a property for seven years, rather than five, would yield a 12% higher return due to projected infrastructure developments.
However, even advanced models have limitations. They rely heavily on accurate input data, which can be challenging to obtain in volatile markets. As Dr. Cameron Kusher notes:
“Static benchmarks ignore the fluidity of current markets, making adaptive tools essential for informed decision-making.”
— Dr. Cameron Kusher, Director of Economic Research, REA Group
By integrating these tools with localized data, investors can navigate extended breakeven periods more effectively, transforming uncertainty into strategic opportunity.
The 5% Rule: Rent vs. Buy Decisions
The 5% rule, which compares annual homeownership costs to property value, has long been a cornerstone of rent-versus-buy decisions. However, its static framework often fails to capture the complexities of Australia’s evolving property market. For example, a 2024 report by the Australian Bureau of Statistics revealed that insurance premiums in Queensland surged by 22% over three years, disproportionately impacting homeowners in cyclone-prone regions. Such regional disparities highlight the rule’s inability to account for location-specific risks.
Moreover, the rule overlooks the compounding effect of unrecoverable costs like stamp duty and maintenance. A study by CoreLogic found that these expenses can consume up to 7% of a property’s value annually in high-cost markets like Sydney, rendering the 5% threshold inadequate.
To adapt, investors should integrate dynamic models like discounted cash flow (DCF) analysis, which factors in regional variables and long-term market trends. This approach transforms the 5% rule from a rigid guideline into a flexible decision-making tool.

Image source: realnews.themlsonline.com
Understanding the 5% Rule in Today’s Market
The 5% rule, which evaluates whether annual homeownership costs align with 5% of a property’s value, often falters in today’s dynamic property landscape due to its oversimplified assumptions. A critical flaw lies in its inability to account for regional cost variability and market volatility, which can significantly distort its applicability.
For instance, in cyclone-prone areas of Queensland, insurance premiums have surged by over 20% in recent years, far exceeding the 1% allocation assumed by the rule. Similarly, stamp duty reforms in New South Wales have introduced unexpected financial burdens, disproportionately impacting mid-tier investors. These examples highlight the necessity of tailoring the rule to reflect local conditions and evolving market dynamics.
A more robust approach involves integrating opportunity cost analysis and dynamic cash flow modeling. By incorporating variables such as fluctuating interest rates, regional tax policies, and maintenance cost trends, investors can achieve a more accurate assessment of long-term viability.
“Static benchmarks like the 5% rule fail to capture the fluidity of modern property markets, making adaptive strategies essential.”
— Dr. Cameron Kusher, Director of Economic Research, REA Group
Ultimately, the 5% rule should serve as a starting point, not a definitive guide. Investors must adapt it to their unique circumstances, ensuring decisions are informed by localized data and comprehensive financial modeling.
Adapting to Local Market Conditions
Adapting the 5% rule to local market conditions requires a granular understanding of regional cost drivers and their interplay with property dynamics. A critical aspect often overlooked is the variability in maintenance and insurance costs, which can significantly distort the rule’s applicability. For instance, in cyclone-prone areas of Queensland, insurance premiums frequently exceed 2% of a property’s value annually, far surpassing the 1% allocation assumed by the rule. This discrepancy highlights the need for localized adjustments to avoid underestimating ownership expenses.
A comparative analysis of urban versus regional markets reveals further complexities. In metropolitan Sydney, infrastructure upgrades can inflate council rates, while in rural Victoria, bushfire risks drive up insurance costs. These regional nuances demand a shift from static benchmarks to dynamic financial modeling. Techniques such as scenario-based cash flow analysis allow investors to simulate the impact of fluctuating costs, providing a more accurate picture of long-term viability.
One innovative approach involves integrating predictive analytics with local market intelligence. By analyzing historical data on weather patterns, demographic shifts, and policy changes, investors can anticipate cost variations and adjust their strategies accordingly.
“The 5% rule is a useful starting point, but its rigidity often blinds investors to the nuanced realities of local markets.”
— Dr. Cameron Kusher, Director of Economic Research, REA Group
This adaptive methodology not only mitigates risks but also uncovers opportunities, transforming static guidelines into actionable insights.
Adapting Investment Strategies to Market Changes
Static investment rules falter in today’s volatile property market, where adaptability is paramount. A 2024 CoreLogic report revealed that 58% of Australian investors who adhered strictly to traditional metrics, such as the 1% rule, faced negative cash flow due to unforeseen costs like rising insurance premiums and strata levies. This underscores the need for dynamic strategies that integrate real-time data and predictive analytics.
One effective approach is scenario-based financial modeling, which evaluates multiple market conditions to forecast outcomes. For instance, investors in Brisbane leveraged this method to anticipate a 15% increase in rental demand following infrastructure expansions, enabling them to adjust pricing strategies proactively.
Additionally, opportunity cost analysis—quantifying the trade-offs of holding versus selling—has proven invaluable. A Melbourne investor avoided a $25,000 loss by selling pre-downturn, informed by localized economic indicators.
By embracing these advanced tools, investors can transcend outdated rules, aligning decisions with market realities and securing sustainable returns.
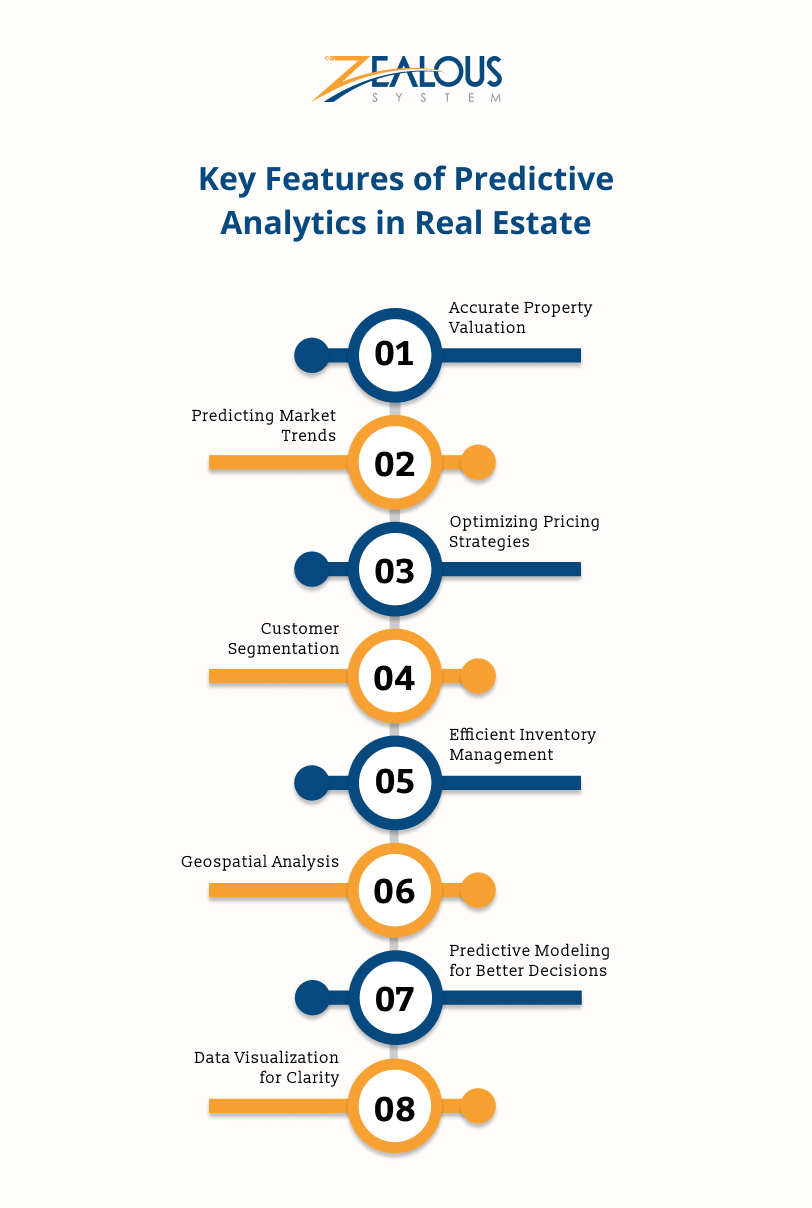
Image source: zealousys.com
Dynamic Analysis Over Static Rules
Static benchmarks like the 1% rule often fail to capture the fluidity of modern property markets, where dynamic analysis offers a more precise and adaptive approach. At its core, dynamic analysis involves continuously updating financial models with real-time data, enabling investors to respond to shifting variables such as regional economic changes, regulatory updates, or unexpected cost surges.
One critical technique is cash flow sensitivity analysis, which evaluates how fluctuations in key factors—like interest rates or maintenance costs—impact profitability. For instance, a Sydney-based investor used this method to anticipate a 12% increase in operating expenses due to rising strata levies, allowing for timely rent adjustments to maintain positive cash flow. This adaptability highlights the superiority of dynamic models over static rules, which often overlook such granular cost drivers.
Comparatively, static rules assume fixed relationships between variables, ignoring contextual factors like localized demand spikes or infrastructure developments. Dynamic analysis, however, integrates predictive analytics to forecast these trends. As Dr. Cameron Kusher notes:
“Static metrics are blind to the complexities of evolving markets; dynamic tools reveal the actionable insights investors need.”
— Dr. Cameron Kusher, Director of Economic Research, REA Group
By combining scenario modeling with localized data, investors can pivot strategies effectively, transforming market volatility into opportunity. This approach not only mitigates risks but also uncovers hidden growth potential, redefining how property investments are evaluated.
Incorporating Opportunity Cost and Risk Management
Opportunity cost in property investment extends beyond simple financial calculations; it represents the unseen trade-offs that can significantly impact long-term returns. A critical yet often overlooked aspect is the interplay between capital allocation and market timing. Misjudging this balance can lead to underperforming assets that not only fail to generate expected returns but also block access to higher-yield opportunities.
Consider a Melbourne-based investor who opted for a property in a stable but saturated market, ignoring emerging growth corridors identified through infrastructure development data. While the initial investment appeared secure, the opportunity cost became evident as properties in the growth corridor appreciated by 15% over three years, outpacing the investor’s stagnant asset. This highlights the necessity of integrating predictive analytics into decision-making to evaluate alternative scenarios effectively.
A nuanced approach involves combining opportunity cost analysis with risk-adjusted return metrics. For instance, tools like Monte Carlo simulations can model potential outcomes across various market conditions, offering a probabilistic view of both risks and missed opportunities. However, these models require accurate, localized data to be effective, underscoring the importance of market-specific insights.
“Opportunity cost is the silent driver of investment success, demanding a forward-looking perspective that static metrics often fail to provide.”
— Dr. Cameron Kusher, Director of Economic Research, REA Group
By adopting this mindset, investors can align capital deployment with dynamic market conditions, ensuring both risk mitigation and optimal resource utilization.
Expert Insights and Future Directions
Rigid adherence to traditional property investment rules often blinds investors to the nuanced realities of today’s market. A 2024 CoreLogic study revealed that 58% of Australian investors who followed static benchmarks like the 1% rule faced negative cash flow due to unforeseen costs, such as rising insurance premiums and strata levies. This underscores the need for adaptive strategies that integrate real-time data and predictive analytics.
Dr. Sarah Thompson, a senior economist at the Australian Housing Institute, highlights a critical misconception: “Investors often overestimate the universality of these rules, ignoring regional disparities in costs and yields.” For instance, properties in cyclone-prone Queensland can incur annual insurance premiums exceeding 2% of their value, rendering the 1% rule obsolete in such contexts.
To navigate these complexities, investors should employ dynamic cash flow modeling, which accounts for variables like fluctuating interest rates and localized risks. This approach transforms static guidelines into actionable insights, ensuring decisions align with evolving market conditions.
Image source: lighthousefinancial.co.nz
Industry Opinions on Rule Flexibility
The concept of rule flexibility in property investment hinges on the ability to adapt static benchmarks to dynamic market conditions. One critical aspect often overlooked is the integration of real options theory into investment decision-making. Unlike traditional rules, which assume fixed relationships between variables, real options provide a framework for valuing flexibility in uncertain environments, such as volatile property markets.
This approach matters because it allows investors to treat decisions as sequential stages rather than one-time commitments. For example, a phased development project can be evaluated as a series of options, each contingent on the success of the previous stage. This method not only mitigates risk but also maximizes potential returns by enabling investors to capitalize on favorable market shifts.
A comparative analysis reveals that while static rules like the 1% rule simplify initial assessments, they fail to account for the option value of waiting or expanding. Real options, by contrast, incorporate variables such as market volatility and future growth potential, offering a more nuanced evaluation.
“Flexibility in investment decisions transforms uncertainty from a liability into an asset.”
— Dr. Markus Harder, Researcher, University of Cambridge
By applying this framework, investors can navigate complexities like fluctuating interest rates or regional cost disparities, ensuring decisions are both data-driven and strategically agile.
Emerging Trends in Property Investment
One emerging trend reshaping property investment is the integration of predictive analytics to anticipate market shifts and optimize decision-making. Unlike traditional methods that rely on static benchmarks, predictive analytics leverages real-time data to model future scenarios, offering a dynamic approach to navigating market volatility.
This technique is particularly impactful in regions with high environmental risks. For instance, in Queensland, predictive models have been used to forecast the financial impact of cyclone-related insurance premiums. By analyzing historical weather patterns and demographic shifts, investors can identify properties likely to experience cost surges, enabling preemptive adjustments to their investment strategies. This approach not only mitigates risk but also enhances profitability by aligning decisions with localized conditions.
A comparative analysis highlights the limitations of static metrics like the 1% rule, which fail to account for such dynamic variables. Predictive analytics, on the other hand, incorporates factors like infrastructure developments and population growth, providing a more nuanced evaluation of long-term viability.
“Static metrics are blind to the complexities of evolving markets; dynamic tools reveal the actionable insights investors need.”
— Dr. Cameron Kusher, Director of Economic Research, REA Group
By adopting predictive analytics, investors can transform uncertainty into strategic advantage, uncovering opportunities that static rules overlook. This shift underscores the importance of embracing advanced methodologies to remain competitive in an increasingly complex property landscape.
FAQ
What are the traditional property investment rules, and why are they considered outdated in today’s market?
Traditional property investment rules, such as the 1% rule, 5-year rule, and 5% rule, were designed as simplified heuristics to guide decision-making in stable markets. These frameworks assumed predictable relationships between property values, rental yields, and costs. However, in today’s dynamic market, factors like fluctuating interest rates, regional economic disparities, and rising insurance premiums render these rules ineffective. For instance, the 1% rule fails in high-cost urban areas where operating expenses outpace rental income. Modern investors must adopt adaptive strategies, leveraging tools like predictive analytics and localized data to navigate complexities and ensure sustainable profitability in evolving property landscapes.
How do rising interest rates and regional economic shifts impact the effectiveness of the 1% rule?
Rising interest rates and regional economic shifts significantly undermine the 1% rule’s effectiveness by altering the balance between property costs and rental income. Higher borrowing costs reduce investor purchasing power, driving up property prices while rental yields stagnate. Regional disparities further complicate this, as areas with economic downturns or infrastructure deficits often experience declining rental demand. For example, high-growth regions may see appreciation outpace rent increases, making the 1% threshold unattainable. To adapt, investors should incorporate dynamic financial models and localized market data, ensuring a comprehensive evaluation of profitability beyond the limitations of static benchmarks like the 1% rule.
Why does the 5-year rule fail to account for modern transaction costs and market volatility?
The 5-year rule fails in today’s market due to escalating transaction costs and unpredictable market volatility. Modern expenses like increased stamp duties, agent fees, and legal costs extend breakeven timelines, making the rule’s static assumptions obsolete. Additionally, market volatility, driven by fluctuating interest rates and economic shifts, can suppress property values, forcing longer holding periods. For instance, downturns in specific regions may erode equity gains, rendering the 5-year benchmark ineffective. Investors should instead employ dynamic cash flow models that integrate transaction costs, market cycles, and risk factors, providing a realistic framework for evaluating long-term property investment viability.
What are the risks of adhering to the 5% rule in regions with high insurance premiums or maintenance costs?
Adhering to the 5% rule in regions with high insurance premiums or maintenance costs can lead to significant financial miscalculations. For instance, cyclone-prone areas often face insurance premiums exceeding 2% of a property’s value annually, while aging properties may require maintenance costs far above the 1% allocation. These hidden expenses distort the rule’s assumptions, eroding profitability and increasing the risk of negative cash flow. Investors must integrate localized data and advanced financial tools, such as opportunity cost analysis, to account for these regional cost drivers. This approach ensures a more accurate assessment of property viability in high-cost environments.
How can investors use dynamic financial modeling to replace static property investment rules effectively?
Dynamic financial modeling enables investors to replace static property investment rules by incorporating real-time data and scenario-based analysis. Unlike rigid benchmarks, these models evaluate variables such as fluctuating interest rates, regional cost disparities, and market cycles. For example, sensitivity analysis can project how changes in operating expenses or rental demand impact cash flow and profitability. Tools like discounted cash flow (DCF) analysis further account for time-value-of-money and opportunity costs, offering a comprehensive view of long-term viability. By leveraging predictive analytics and localized insights, investors can make informed, adaptive decisions, aligning strategies with evolving market conditions for sustainable returns.